This article, first appearing in Hart’s E&P Magazine, presents a comprehensive analysis of differentiating pressure changes due to wellbore effects from those caused by reservoir responses in pressure-testing of wells. It focuses on the complexities involved in testing gas/condensate or volatile oil wells, especially with downhole gauges. The paper delves into the phenomenon of liquid fallback and re-injection in gas/condensate reservoirs, illustrating the process through figures and test data from a Gulf of Mexico well. It emphasizes the importance of accurate test interpretation, addressing common misattributions of wellbore phenomena as reservoir effects. The study concludes with practical insights for analyzing well tests under challenging conditions, highlighting the critical need for understanding fluid behavior in both the wellbore and the reservoir for accurate well test analysis.
Is it Well Bore or Reservoir? Understanding Re-injection Effects during a Well Test
When pressure-testing a well from the surface, it is extremely important to be able to differentiate between pressure changes caused by wellbore effects and the pressure response from the reservoir. Perhaps surprisingly, it is also critical to recognize these differences in downhole gauge data. When testing gas/condensate or volatile oil wells, downhole gauges can respond to the same things that affect surface data. Unfortunately, the downhole gauge data is almost never questioned, regardless of the actual depth at which the gauge is set. During analysis/test interpretation, artifacts in the bottomhole pressure data, which should be attributed to the WELL BORE, such as phase redistribution and temperature related phase/density changes are often mistaken for dual porosity or condensate banking in the RESERVOIR. In gas/condensate reservoirs, the most common of these effects, which shows up during a build-up if the reservoir pressure has dropped below the dew point, is the phenomenon of liquid fallback and re-injection.
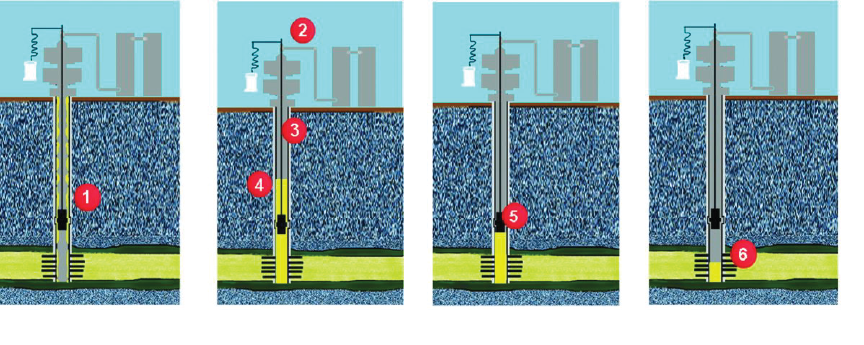
Figure 1 illustrates what happens in the well bore during this process:
-
- While the well is under production, the liquids are lifted by the gas. If the gas rate is above the critical unloading velocity, there will be no liquid column in the well.
- When the well is shut-in, the gas rate becomes zero.
- The liquid that was being lifted by the gas falls to the bottom of the well.
- If enough liquid is present, a liquid column will form in the well. (Data collected with a pressure gauge that is above the liquid column will not reflect the true reservoir/bottomhole pressure.)
- If gas is the continuous phase in the reservoir, gas will bubble through the liquid and force the liquid into the formation; the liquid column height will decrease with time. (If a liquid is the continuous phase in the reservoir, re-injection will not occur.)
- Once the liquid level drops to the perforations, the well bore will contain single-phase gas from the surface to the perforations; pressure acquired from the surface will become valid.
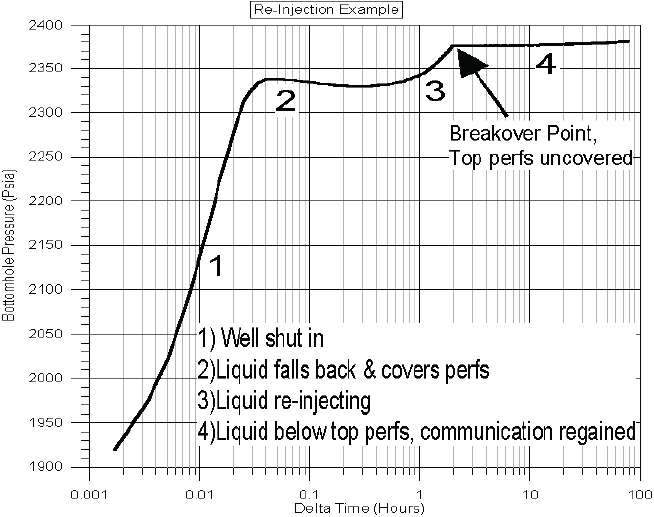
The plot that we use to diagnose whether or not re-injection is occurring is a semi-log plot (log of shut-in time on the x-axis; linear pressure on the y-axis) as shown in Figure 2. Starting from the left-hand side of the plot, the re-injection “signature” is:
-
- The pressure initially builds (mostly a skin effect in a high-perm reservoir)
- The pressure then peaks and lays flat or drops (liquid column building)
- The pressure then makes a “J” or hook-shape (liquid column re-injecting)
- The pressure breaks over to a much less steep slope (liquid column gone)
As an example of this mechanism, consider the following test data, which was acquired using a SPIDR system at the surface and a dual quartz downhole bomb on a gas/condensate well in the Gulf of Mexico:
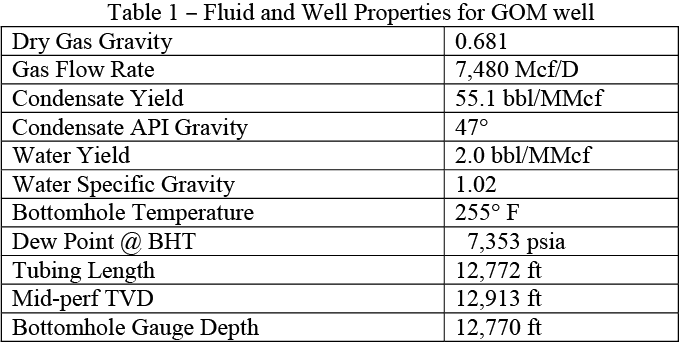
The well was a straight hole (Midperf: TVD = 12,910’, MD = 12,914’), located on the continental shelf of the Gulf of Mexico. The gas rate prior to shut-in was approximately 7.5 MMcf/D. The well was also producing 410 bbl/d of 47° API of condensate and 15 bbl/d of water. The downhole gauge was run to the X-nipple, at a MD of 12,770’; flow was not interrupted to run the gauges. The SPIDR was installed on the blow-down valve of the wire-line lubricator. After the downhole gauge had been on bottom for 30 minutes, the well was shut-in at the manual wing valve. The SPIDR data was then converted from WHP to BHP (the details appear later in the paper) and compared to the measured downhole gauge data. The summary is as follows:
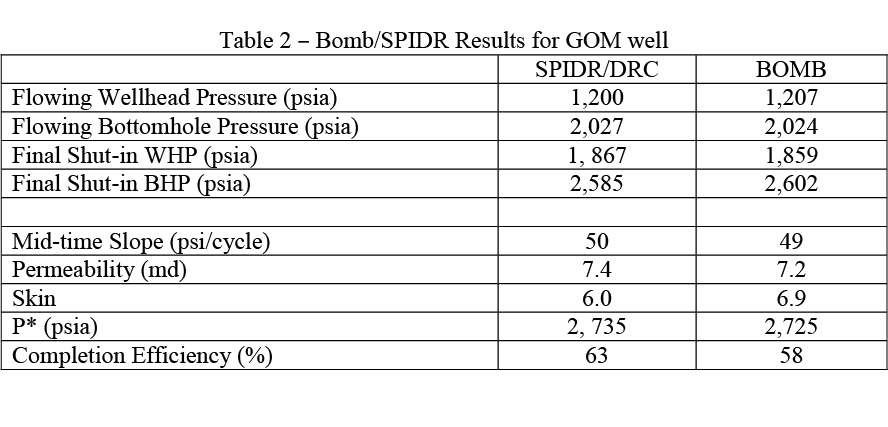
For the flowing BHP conversion, DRC’s Mist Flow Algorithm was used. As can be seen in the table above, the calculated FBHP was within 3 psi of that measured with the downhole bomb. On the build-up, DRC’s thermal decay algorithm was used to correct for changes in density related to wellbore cooling. In addition, DRC’s wellbore flash calculation was performed to determine the amount of condensate that would remain in solution with the gas phase and the amount that would drop-out and fall to the bottom of the well (and hopefully re-inject into the formation). As shown in the summary table, the difference in the calculated final SIBHP and measured SIBHP was 17 psi.
The interesting thing about this test showed up when we did an overlay plot of the build-up data sets (after adjusting our data to account for the 17 psi scalar error). Based on the liquid yield and the fact that the wellbore and reservoir pressures were below the dew point, we had expected to see some sort of re-injection effect in the SPIDR data. Upon inspection, we also saw re-injection effects in the downhole gauge data.
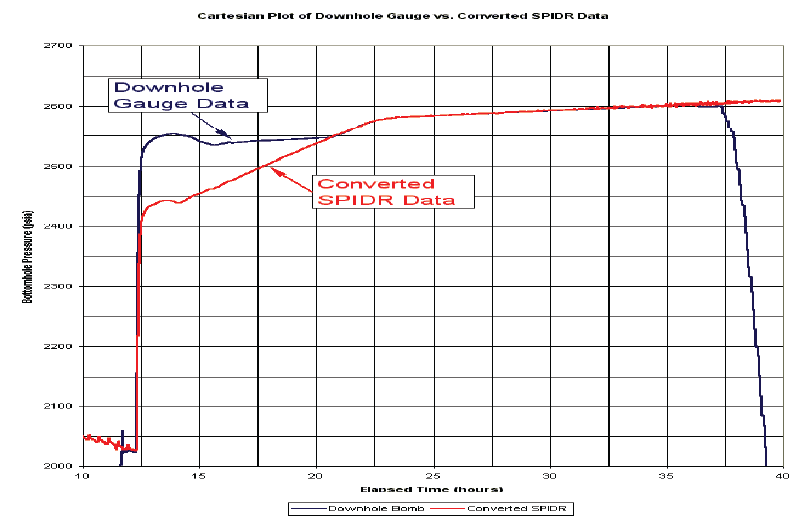
In Figure 3, the downhole gauge data is plotted vs. the calculated bottomhole pressures on a Cartesian scale. The y-axis has been offset 17 psi in order to discuss the relative differences during the build-up. Let’s start at the end of the shut-in and work our way back. The SPIDR data and the bomb data track each other for the last 18 hours of the build-up. However, they do not match during the first eight hours. We strongly suspected that we had liquid re-injection in the SPIDR data, but were a bit curious as to what was going on with the bomb data. It looked valid for the first two hours, or at least it looked like a normal build-up. Then, the pressure fell for two hours and increased slightly for about 4 hours, before increasing again at the point where the SPIDR data converges with it (8 hr).
The semi-log plot of the SPIDR data (Figure 4) shows the re-injection signature – it initially builds, then lays flat (and drops slightly), and is followed by a “J” or hook-shape, which then breaks over and then behaves like normal build-up data. In this case, the bomb data actually looks good for the first 1½ hours. Then, the pressures drop and lay flat for a few hours until they hook up, and then track the SPIDR data.
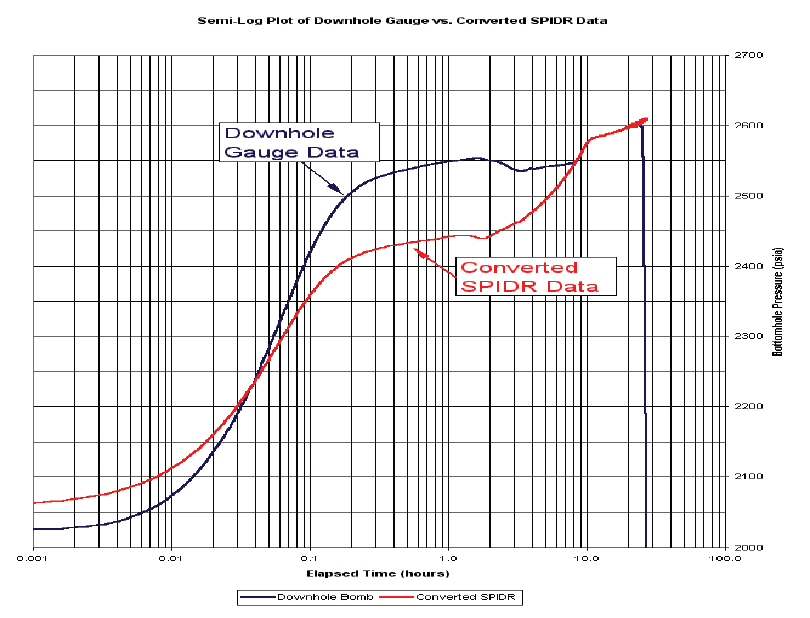
So, while we had an acceptable explanation for what was going on in the SPIDR data, we needed to find out what was causing the bomb data to look strange. It turned out that the explanation was related to the location of the bomb…
Here’s what happened: When the well was shut-in, almost all of the condensate (92%) that was being conveyed by the gas fell back down the well bore. The liquid formed a column, which had an initial height of 280’ (according to our calculations) above mid-perf. The downhole gauge was set 140’ above mid-perf. Thus, the downhole gauge had single-phase liquid between it and the perforations for the first two hours of the build-up. Then, as the liquid level dropped below the downhole gauge, the measured pressure decreased and then began showing re-injection effects, which the SPIDR had shown throughout the build-up (since the liquid level was between it and the perforations the whole time).
How do I analyze this?
Trying to analyze a well test where the pressure gauge was above a moving liquid level can be quite difficult, especially since well-test software is not designed to deal with it. Basically, the way to do it is to wait until the re-injection period has passed and keep your fingers crossed that you didn’t hit any boundaries before the liquid level dropped to the perfs. In the GOM example above, the downhole bomb data appeared valid for the first couple of hours and had the same mid-time slope at 1 hr (with single-phase liquid to the perfs) as it did at 10 hrs (with single-phase gas to the perfs), indicating that no boundaries were encountered during the re-injection period. So, in this case we were able to provide analysis for both the downhole bomb and the SPIDR data. (See Table 2 for the results.)
Qualitative analysis
Some of the time, we aren’t lucky enough to get quantitative results. In cases where there is no downhole bomb data or in cases where the downhole bomb was set hundreds (or even thousands) of feet above the perforations, re-injection effects will affect the data from the time of shut-in until the end of re-injection. If there is no valid data prior to the end of the build-up period and if there is no valid drawdown data, analysis may still be possible, but may only be of a qualitative nature (high perm, low perm; high skin, low skin, etc.). However, if the build-up is conducted long enough for the liquids to re-inject, it should still be possible to get a valid P*.
OK, so it’s a problem. What do I do about it?
1) Test early.
The best way to deal with liquid-fallback & re-injection is to avoid it. So, if you’ve got a gas/condensate well, test the well before the reservoir pressure gets below the dew point. If there isn’t a liquid phase in the well bore, there won’t be anything that can fall back and foul up the test. An additional advantage to testing before phase behavior becomes and issue is that you’ll get a good idea of how long it takes to hit the first boundary. If later build-up tests show that re-injection ended before you hit the first limit, the test should be easy to analyze.
2) Do a follow-on drawdown.
In general, the best way to test a well is with a drawdown. There are two reasons for this:
A) Constant choke drawdown pressures are less affected by phase behavior and density/temperature changes than build-ups. However, if poor quality mechanical strain or piezoelectric strain silicon/sapphire gauges are used on high temperature wells, inadequate thermal compensation of the gauge can cause significant errors in the pressure (which is a whole other can of worms).
B) Management complains much less if you tell them that you want to test your well by producing it. The only problem here is that you have to shut the well in prior to the DD, so it’s best to wait for some expected down-time…the best time to test is when nobody’s lookin’.
The catch is, in order to get valid DD data, the FWHP has to be 2.2 times the line pressure (to ensure critical flow through the choke). If the well is “riding the line”, the drawdown data will not be isolated from downstream disturbances, and therefore, may not be valid. To summarize, if the flowing tubing pressures are 2.2 times greater than the line pressure, do a build-up followed by a drawdown. In this fashion, P* can be calculated from the build-up. Skin, permeability and boundaries can be calculated from the drawdown. This is the most reliable method to get accurate quantitative analysis on wells that will exhibit re-injection.
3) Do a 2-rate test.
In general, these tests should yield some ballpark numbers for skin and perm, but usually provide less reliable quantitative results. The way to perform the test is to put gauges in or on the well and record flowing pressures at a given choke size. The choke is then reduced and a pseudo-buildup is recorded and analyzed by using effective rates and a few other mathematical shenanigans related to superposition theory. These tests should only be attempted if it is not possible to get valid drawdown data.
4) Hope you get lucky.
If you don’t hit boundaries before re-injection has finished, just ignore the section of data that isn’t valid and analyze the data that is.
Be careful…
There are a lot of strange things that go on during well tests that show up in both surface and downhole gauge data. Some of them happen in the well bore; some of them happen in the reservoir. An understanding of fluid behavior in both places is critical to accurate well test analysis. In gas/condensate reservoirs, liquid fallback and re-injection poses significant problems to both test design and interpretation. If you know it’s going to happen ahead of time, it is much easier to design a test program to get the results you need from the test. If the reservoir pressure is below the dew point, liquid fallback and re-injection is going to happen. Expect it; don’t assume that everything in the surface or downhole gauge data happened in the reservoir.
There are a lot of strange things that go on during well tests that show up in both surface and downhole gauge data. Some of them happen in the well bore; some of them happen in the reservoir. An understanding of fluid behavior in both places is critical to accurate well test analysis. In gas/condensate reservoirs, liquid fallback and re-injection poses significant problems to both test design and interpretation. If you know it’s going to happen ahead of time, it is much easier to design a test program to get the results you need from the test. If the reservoir pressure is below the dew point, liquid fallback and re-injection is going to happen. Expect it; don’t assume that everything in the surface or downhole gauge data happened in the reservoir.

