

Abstract
This article will address two issues related to sand production in unconsolidated reservoirs. First, it will examine the relationship between formation compressibility (Cf), elastoplastic hysteresis, and the shear failure of the formation macroscopically (when the fluid and formation pressure together cannot support the overburden stress), as well as the methodology to predict this failure pressure. Second, it will explore the means to recognize which formations are more friable and likely to produce sand grains – microscopic shear failure. The two effects are only tangentially related but can occur simultaneously.
Logs and petrophysical data should be methodologically used to qualitatively and quantitatively assess the sanding potential of a well or reservoir. The first method is evaluating the compressibility of formation rocks as they first demonstrate elastoplasticity, and then have catastrophic shear failure. The other method evaluates the sanding potential based on the friability of the formation.
The most effective way to manage/mitigate catastrophic/macroscopic shear failure is to observe the dynamic behavior of the reservoir. By plotting the build-up permeability vs. skin-less FBHP, the failure pressure of the formation can be determined. Good operating practices then dictate that the well should not be flowed at pressures below the value plus a safety factor. The approach to managing potential sand grain failure (microscopic shear failure) is to design the completion (frac-pack, gravel pack, etc.) to collect the sand grains in the pack and screens, then perform periodic pump-in stimulation treatments to push the fines away from the screens/pack. Two examples, each from the Gulf of Mexico and the Louisiana Gulf Coast, will be presented to demonstrate the methodology for both macroscopic and microscopic shear failure.
It should be noted that it is important to differentiate the cause of sand production/fines migration as one of the two (macro/micro) causes. This can be determined by tracking the accretion of skin due to fines. If this occurs coincident with a decrease in permeability or mobility thickness, it should be assumed that the cause is macroscopic shear failure. If the permeability remains constant as skin due to fines increases, it is due to microscopic shear failure. Technically, both mechanisms can occur simultaneously, but it is best to approach the issue conservatively and assume that any increase in skin due to fines that occur with a decrease in mobility thickness is due to macroscopic shear failure. Applying the sanding potential systematically to formation evaluation can improve the completion design; predicting the macroscopic shear failure pressure of the formation contributes to better overall reservoir management.
Introduction
Determining the sanding potential and identifying factors that can potentially affect macroscopic shear failure will both aid in better completion selection/design and also improve reservoir management practices. By using both petrophysical data and dynamic production data, the well/reservoir can be surveilled to manage the macroscopic shear failure of the formation and to mitigate the impairment caused by friable sand grain production (microscopic shear failure). Knowledge of these parameters should allow operators to improve their estimated ultimate recovery (EUR), by both designing the most effective completion, and then not excessively stressing the formation by exceeding the macroscopic shear failure inducing minimum flowing BHP.
Figure 1 illustrates the differences between the sanding mechanisms of macroscopic shear failure and microscopic shear failure due to friability. Both mechanisms will be covered in the following sections of this paper.
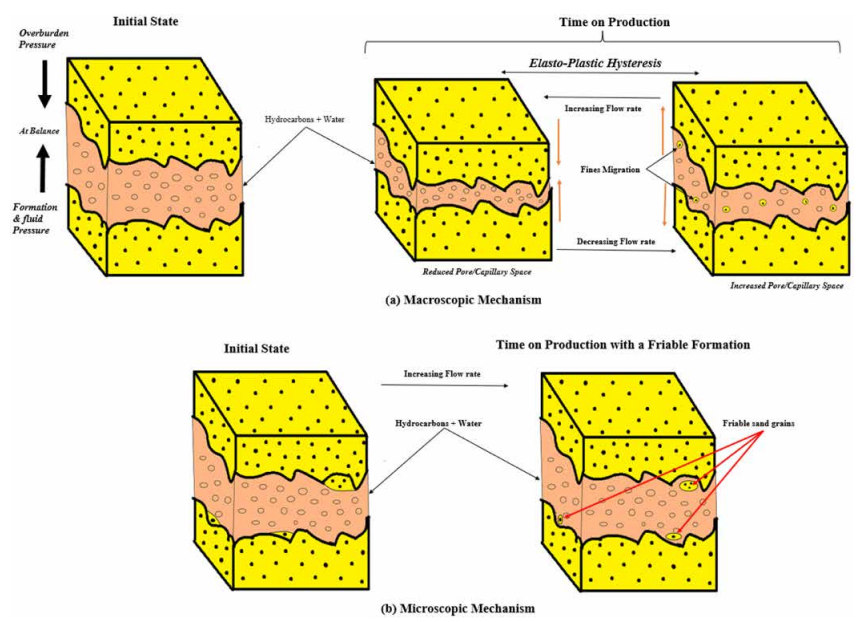
Figure 1 - (a) illustrating shear failure mechanisms accompanied by macroscopic plastic hysteresis and fines migration (b) Illustrating shear failure with microscopic friability of the sand grains with an existing sanding potential
Statement of Theory and Methodology
Shear Failure and the “Four-Horsemen” – Macroscopic Shear Failure
Every petroleum system can be considered as a total system of energy that includes energy sourced from the hydrocarbons, water, and formation. This can be better understood in terms of compressibility. The total compressibility of the system is the sum of the compressibility of hydrocarbons and water (accounting for saturations) and the formation compressibility as shown in Eq. 1.

Depending on degree of compressibility, oil and gas reservoirs tend to undergo cycles of elongation (drawdowns) and relaxation (build-ups), leading to elasto-plastic hysteresis. This results in permanent deformation over time, i.e., a rubber band stretched and relaxed over time loses its elasticity and deforms. This is then followed by shear failure (the inability of the formation and the fluids to support the overburden)
Based on extensive research on normal-pressured and geo-pressured reservoirs in the Gulf of Mexico (performed by Oilfield Data Services, Inc.), Table 1 indicates the potential to fail due to shearing, based on the formation compressibility.
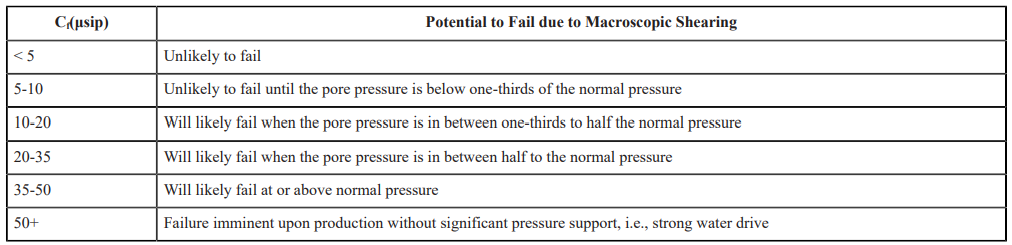
Table 1 - Formation Compressibility and Macroscopic Shear Failure in the Gulf of Mexico
However, the above guideline comes with caveats or the “The Four Horsemen”, otherwise known as omens of the apocalypse.
-
-
- 1st Horseman: First sign of non-aquifer water production or liberated bound water production, often referred to as ‘broken rock water’.
- 2nd Horseman: Decrease in permeability (near wellbore) due to pressure depletion with time. Decrease in permeability is caused by a reduction in pore/capillary space as a result of repeated permanent deformation or elasto-plastic hysteresis over time. Permeability degradation is also caused by stress-induced elongation of the pore throats, some of which can be recovered with lower drawdowns. It should be noted that the 2nd horseman mentioned here can occur before the 1st or the two are interchangeable depending on the field/formation.
- 3rd Horseman: First sign of sand production. Typically observed by an increase in skin due to increased fines migration or sand grain production that are not caused by friability of the formation. At this stage, the effects of the previous two horsemen progressively worsen. With increased permeability degradation coupled with skin accretion due to fines and/or scale or potentially asphaltene deposition.
- 4th Horseman: Catastrophic shear failure, or the well apocalypse, resulting in failure of the completion, casing and/or well bore.
-
While Table 1 provides some rough guidelines, dynamic data (especially build-ups) provides more precise information on shear failure. The most accurate way to determine the shear failure pressure of a formation is to track the permeability (or mobility-thickness for wells that are multi-phase in the reservoir) with skinless flowing bottomhole pressure (FBHP + DPskin). A reservoir with an initial formation compressibility below 20 μsip will tend to have a linear decrease in permeability with pressure, reservoirs with a Cf
between 20-50 will tend to be quadradic, and reservoirs with a Cf above 50 μsip will exhibit rate-dependent permeability and likely fail with minimum drawdown.
Figure 2 displays plots of two different wells in the Gulf of Mexico. The well with data plotted on the LHS has a Cf of 15 μsip, and the permeability exhibits a linear decay with skinless flowing bottomhole pressure. The well on the RHS has a Cf of 25 μsip, and the permeability exhibits a quadratic decay with skinless flowing bottomhole pressure. The former has a failure pressure of 4,941 psia while the latter has a failure pressure of 7,667 psia. If the reservoir makes multi-phase fluids, an alternative method is to plot mobility-thickness with time, in the same fashion that permeability is plotted above for single-phase reservoir fluids.
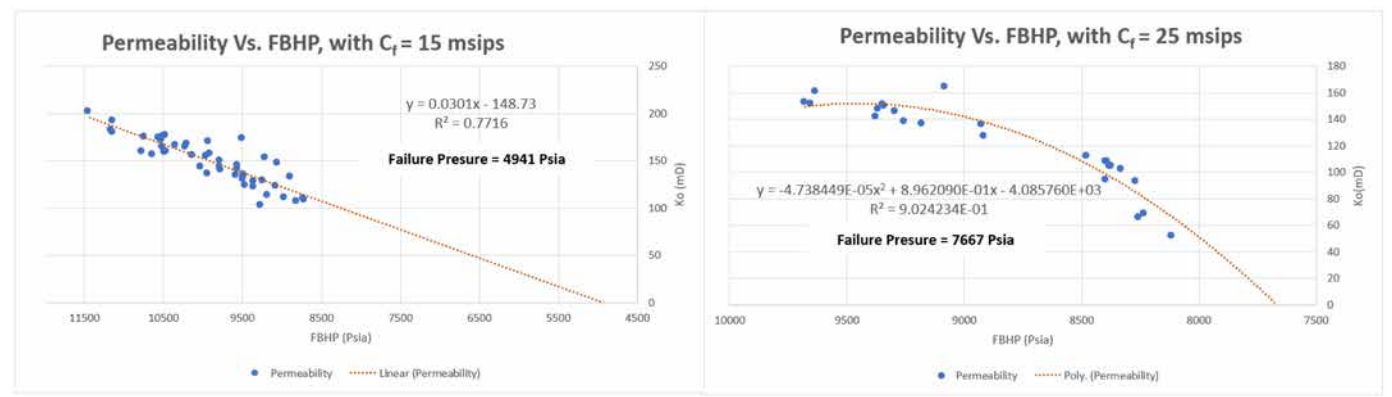
Figure 2 - Impact of the permeability curve and flowing bottomhole pressure on shear failure prediction
To summarize the methodology for predicting shear failure, use Table 1 to get approximate values, then use the permeability or mobility-thickness plots and curve fits to determine the point where the formation will fail (macroscopic shear failure). Do not flow below this value plus a 250-500 psi safety factor. Note, formations that have a compressibility as low as 8 μsip have displayed signs of elasto-plastic hysteresis. Repeated elongation and relaxation of the formation causes additional shearing of the sand grains. Elasto-plastic hysteresis with time results in lower or reduced permeability. Additional drawdown also leads to more elongation and a reduction in the permeability. If the drawdown is not managed effectively, this can lead to a geometric decay in the permeability.
Production is often accompanied by fines migration this can be quantified by monitoring skin and the delta pressure from skin. Note that when considering sand production, close attention needs to be placed on the source of the skin. Other sources of skin such as scale from water production or from asphaltene depositon need to be isolated. If the additional pressure drop due to fines migration is left untreated, it can accelerate the time frame to shear failure, especially if it’s accompanied with free water production. Based on the formation and field type, a threshold on the DP-skin should be established. Once this threshold is exceeded, operators are advised to inject a benign fluid that is compatibile with the formation and with the screens to push the fines and/or sheared sand grains away from the near wellbore region. Additionally, treat other causes of skin if applicable.
Figure 3 displays an increase in skin and DP-skin. The early increase in skin (gold line) is solely due to fines. Prior to water production it is prudent to note the first sign of water and determine if it is ‘broken rock’ water or free/continuous water (i.e. from an aquifer or injection source). Water production weakens the remaining cementation of the sand grains. The effect water rates can have on weaking the cementation of sand grains is currently unquantifiable, but can be estimated from analog data. Additionally, water production increases the skin through possible scale deposition on the screens. The second period (red line) is due to both fines and scale deposition with time. Note that delta-pressure skin from fines migration is displays a linear relationship with time. Similarly, scale deposition with fines migration has a steeper linear relationship with time as compared to only fines migration. Note that the slopes drawn are for visual representation highlighting the difference in trends following the two mechanisms. By monitoring the delta-pressure skin, an optimum stimulation program can be established. While waiting for stimulation treatments it is advisable to curtail overall rates to minimize the increase in sanding potential.
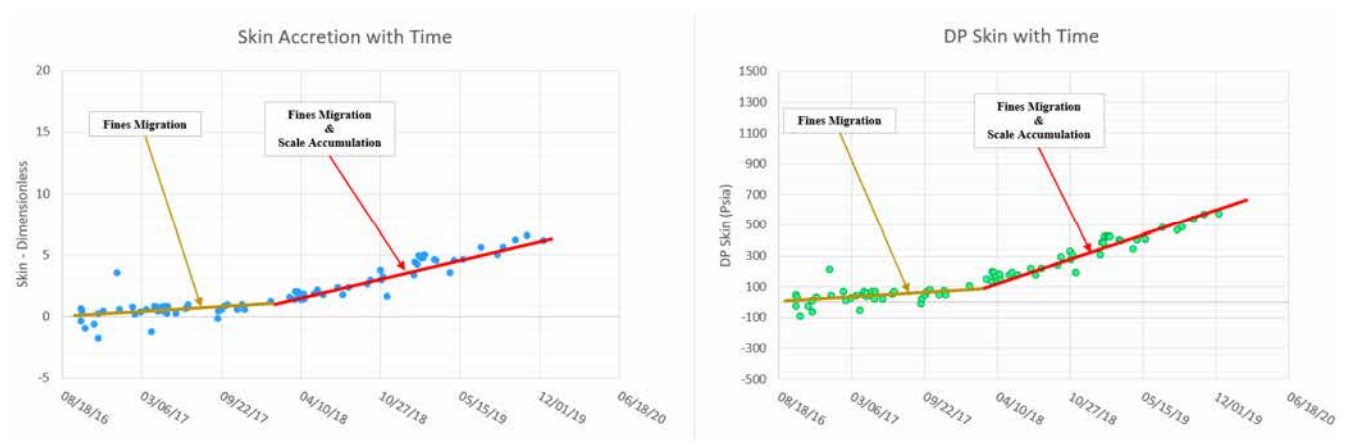
Figure 3 - Skin accretion with time with associated DP Skin highlighting damage mechanisms.
Note: gold represents fines migration, and red represents fines migration and scale accumulation.
The previous section addressed sand production/fines migration due to the inability of the formation to support the overburden. In contrast, the following section addresses sand production of friable sand grains. This section will also include a methodology to evaluate this sanding potential due to friability. This combines information from common industry sources such as bulk density/neutron logs, sonic logs, historical production data, and formation compressibility along with commonly accepted scientific principles to interpret the strength of the formation.
Strength of Materials: A Qualitative Approach – Microscopic Shear Failure
A qualitative approach to determining the formation strength begins with using the following petrophysical logs to interpret sanding potential.
Acoustic/Sonic Logs measure the interval transit time of elastic waves travelling through one foot of the formation. Thus, the acoustic and sonic logs provide the speed of compressional waves or P-waves, shear waves or S waves, and determine formation compressibility.
Bulk Density Logs measure the formation bulk density or electron density of a formation using gamma rays.
Neutron Porosity Logs measure the neutron energy loss in hydrogen-concentrated zones of the formation that is related to porosity.
With the above three logging tools, the sanding potential of the zone of interest can be inferred as less compact zones are prone to sanding. Compaction is evaluated using the relationship described in Eq. 2.

Thus, the higher the transit time of the compressional wave (or lower/slower velocity), the less compact it is, and the more likely to sand. The reverse situation is also true; the more compact, the less likely to sand. The same can be inferred using density, i.e., Equation 2 implies the higher the density, the more compact and stronger the formation is. With this process, zones within the pay that have the potential to sand can be flagged.
If the sonic logs are equipped to measure compressional waves and shear waves, this data along with the density log permits the calculation of the mechanical properties of the rock. This provides a means to validate previously flagged zones quantitatively.
Mechanical Rock Properties
Mechanical rock properties that should be calculated are: Lamé’s parameters, Young’s modulus, bulk modulus, and shear modulus. These properties are known as the Mechanical Properties Log (MPL) and employed in the methodology of this paper.

Poisson’s Ratio is the ratio of transversal elongation to the axial compression which can be calculated using Lamé’s parameters from Eq. 3 and Eq. 4.

Young’s Modulus is the ratio of tensile stress to tensile strain. Here, it describes the ability of the formation to stretch and deform and is calculated using Lamé’s parameters from Eq. 3 and Eq. 4.

Bulk Modulus is a measure of how volumetrically resistant the formation is to compression and is calculated using Lamé’s parameters from Eq. 3 and Eq. 4.

Bulk Compressibility is a measure of being volumetrically reduced by pressure and is calculated as the inverse of bulk modulus defined in Eq. 7.

Shear Modulus, also known as modulus of rigidity, is a ratio of shear stress to strain. This is Lamé’s second parameter. For consistency of units in the methods described in this paper it is divided by a million.

Brittleness: Using Young’s Modulus (Eq. 6) and Poisson’s Ratio (Eq. 5), a brittleness index can be calculated.

Additionally, brittleness is a mechanical rock property often mistaken in reference to sanding, i.e. “The formation is brittle; it will sand”. Sanding potential cannot be determined from brittleness alone. Brittleness can be better understood with porosity. If the porosity decreases, the more brittle it becomes. A decrease in porosity points to a tighter formation or increased cementation of the sand grains. However, an increase in porosity indicates weaker cementation of the sand grains or higher friability. Friability, or the ability of the sand grains to break down, is the main property that characterizes the strength of a material that directly corresponds to the sanding potential. Thus, we can validate the potential sanding zones using the above correlation with the porosity log. Based on the MPL the following methods offer a quantitative means to assess sands capable of producing hydrocarbons without sand control.
Approaches to Quantifying Sanding Potential
Tixier Approach. Tixier et al. (1975) uses a critical value of 0.8 × 10¹² psi2
on the mechanical properties log or the ratio of shear modulus to bulk compressibility. Note that this criterion does not account for hydrocarbon corrections. Without the correction, this threshold is a conservative set point for evaluating sanding potential. Values greater than this set threshold should present no sanding problems. This corresponds to a shear modulus (G) from Eq. 9 of 0.6 × 10⁶ psi and bulk compressibility (Cb) from Eq. 8 of 0.75 × 10⁻⁶ sq in./lb as the critical threshold points for sanding. Therefore:

Sharma Approach. Sharma and Arya (2006) followed Tixier’s work, where the product of shear and bulk moduli would offer a greater range of sensitivity than considering these terms independently. In their work with gas reservoirs, they termed the product of shear modulus (G) and bulk modulus (K) as “Formation Strength Index” (FSI) to define a threshold for sand cut analysis (Eq. 11).

If a reservoir has an ‘fsi’ less than 2.4 × 10¹² psi2 it is a candidate for possible sand cut.
If a reservoir has an ‘fsi’ greater than 2.9 × 10¹² psi2 , it will be a sand free gas producer.
With the FSI from Eq. 11, the above thresholds can be tuned based on previously sanded analog wells or known reservoirs, to predict if an oil or gas well will cut sand. Likewise, Tixier et al.’s critical MPL criterion can be tuned when used in conjunction with the available production history from operators.
Schlumberger Sanding Index. Dong et al. (2013) documented the Schlumberger Sanding Index (SR) where the sanding index is the product of the bulk modulus (K) from Eq. 7 and the shear modulus (G) from Eq. 9

B-Index (Sand Production Index). Dong et al. (2013) further documented the Sand Production Index, which he referred to as “B-index”. Where the sand production index is the sum of the bulk modulus (K) from Eq. 7 and 4/3 times the shear modulus (G) from Eq. 9.
Using the process, based on the friability, operators can decide if they need to have a gravel-pack or frac-pack as a part of their completion design. This can help curtail the sanding potential. It also provides a means to trap the sand and prevent it from entering the wellbore.
Case Studies
Evaluating Perforation Decision Based on Sanding Potential
An onshore Lousiana operator drilled a well with a brittle formation, their decision to perforate without sand control was hindered by the unknown sanding potential of the planned interval. Employing the methodology in this paper, the planned perforating interval was evaluated to determine if it was prone to sanding. The data they provided included the following logs, acoustic/sonic, density, neutron porosity, and the mechanical
properties log with readings every half of a foot.
The previously mentioned equations were used to evaluate the brittleness index based on the data from the logs. Using Figure 4, it was noted that the formation gets more brittle from 9045 to 9051 ft as compared to the planned perforation interval of 9,040 to 9,044 ft. However, this does not mean that the interval chosen to perforate will not sand.
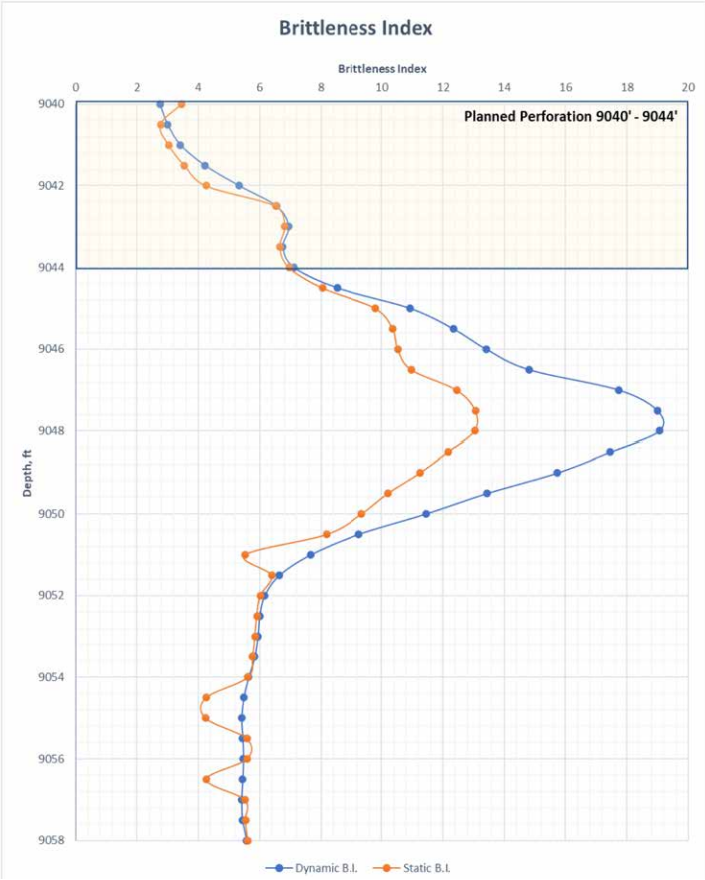
Figure 4 - Brittleness index data gathered every half foot
Note: The box at the top of the graphic indicates the planned performance interval.
Using the relation density to compaction or P-waves from Eq. 2, Figure 5 shows that the density is the dominant factor. Had the density remained approximately constant for the brittle zone, while the P-waves transit time dropped, it could be inferred that, the formation is less compact and therefore susceptible to friability. However, the decrease in porosity, for the same depth interval, suggests that the formation may not be as friable.
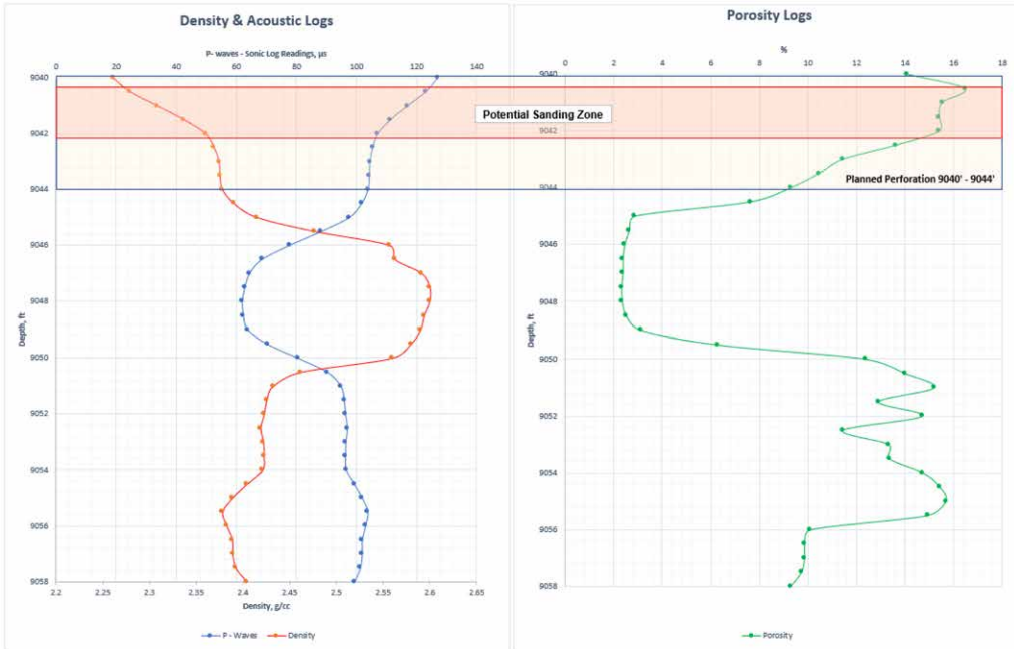
Figure 5 - Density/acoustic and porosity logs for the same formation
Note: The orange box indicates a potential sanding zone in the upper planned perforation zone.
However, on evaluating the planned perforated zone, it can be observed that from ~9,040.5 to 9,042 ft (orange box in Figure 5) the lower density, higher transit time of the P waves, and higher porosity could indicate that the formation may not be as compact and is likely more friable or has the potential to sand.
Evaluating the sanding potential for the planned interval using the material properties log based on the methodologies discussed in this paper yielded the following projections shown in Table 2. Based on these results of this study, the Tixier Approach, the Schlumberger Sanding Index, and the B-Index (Sand Production) produced the closest agreement. All the methods predicted the sand cut in the upper section of the planned performation zone. This exercise combined with the field outcome validated the qualitative approach of Strength of Materials method that predicted the sanding potential.
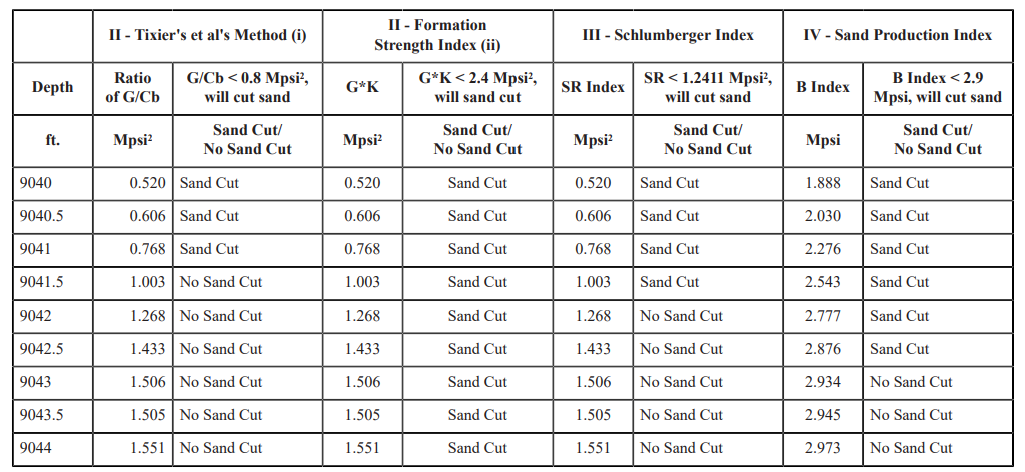
Table 2 - Analysis of the planned interval using the four different MPL methodologies
The Sharma Method predicted that the entire interval would sand. Conservative as it is, the threshold of 2.4 Mpsi2 is based on an analogous gas reservoir that previously sanded in the offshore western basin in India. Note that there was no hydrocarbon correction applied to Tixier et al.’s approach. Furthermore, none of the thresholds of the respective methods were tuned to the specific area or known properties of the field or reservoir. The threshold can be tuned based on previously sanded reservoirs or by using the Strength of Materials method in conjunction with the rest of the methods. For example, the formation strength index could have a threshold set at 1.27 Mpsi2 for this case study thus producing a more accurate threshold to identify sanding potential. After presenting these results to the operator, they decided that their planned perforation was not brittle and thus, would not sand. Months after completing the well, they had a wellbore full of sand.
Evaluating the Sanding Potential Based on a Previously Sanded Zone
An operator in the Gulf of Mexico had a gas-condensate well that watered out and produced sand with a net production of 18 Bcf. They decided to move up-hole and complete a new zone. They were concerned that this formation would sand up because it was similar to the previous zone with a shale break of ~20 feet between the two sands.
The operators had previously run a triple combo log and a sonic log with only compressible or P-waves. Based on the overall methodology, it’s impossible to calculate the MPL without the shear waves or S-waves of the sonic logs. Nonetheless, it is still possible to determine the sanding potential qualitatively, using the density and sonic log compared to the porosity log.
Based on the qualitative analysis, zones with varying degrees of sanding potential were identified. The zone in red (top box in Figure 6) has the highest potential while the zone in yellow has the lowest potential to produce sand. The lower sand had a total net pay zone of 32 ft of which ~11.5 ft has the potential to sand. The same analysis was used to evaluate the upper sand for sanding potential. The upper sand has a total net pay zone of 23 ft of which ~5.5 ft has the potential to sand.
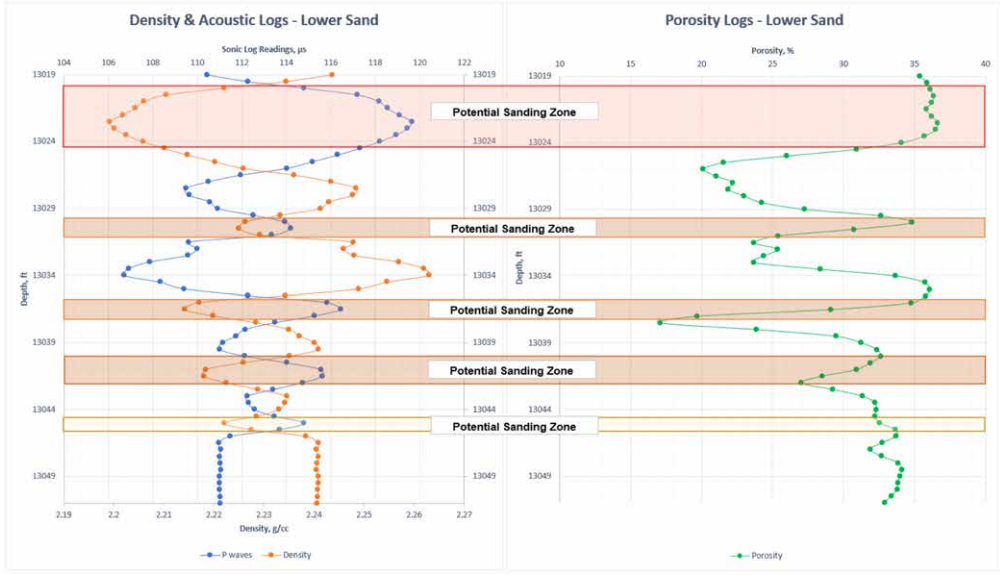
Figure 6 - Comparison of Density/Acoustic logs and Porosity logs for Gulf of Mexico well
Note the 5 zones for potential sanding.
The upper sand (Figure 7) was stronger as compared to the lower sand (Figure 6). Note that the zone highlighted in green beginning at ~12,960 ft that shows “no potential for sanding” because the porosity decreased indicating better cementation of the sand grains.
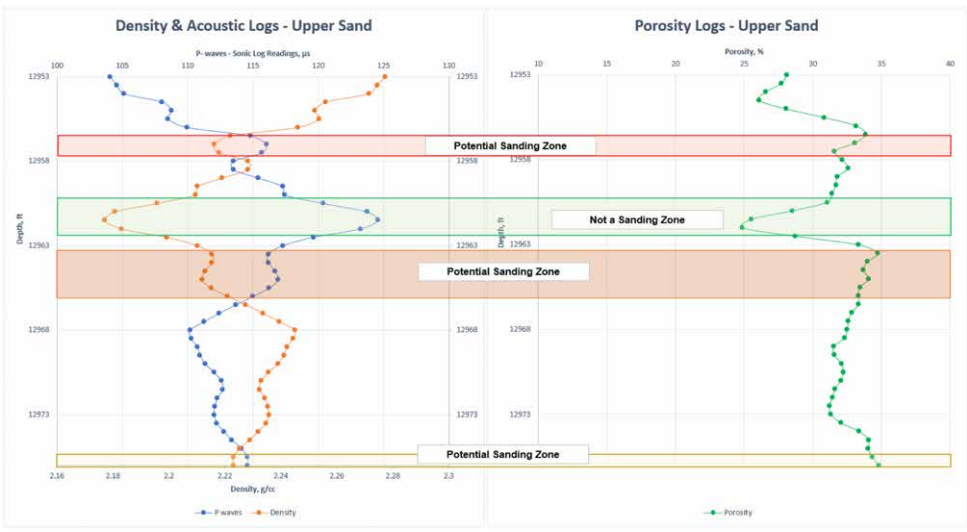
Figure 7 - Same plots as Figure 6 for the lower sand with green box highlighting zone that shows no potential for sanding
However, the upper sand still has the potential to sand and closer attention needs to be placed on production operations to prevent an increase in sanding potential or restrain it to the initial static assessment. It was therefore recommended to gravel-pack or frac-pack this zone, then survielle the well to track changes in skin and/or permeability.
Conclusions
Using the above methodology of evaluating the potential for microscopic shear failure, zones prone to sanding can be identified. The decision to have a gravel pack or frac pack versus a natural completion should be based on the friability of the formation or microscopic shear failure. A qualitative analysis of the sanding potential is possible given access to the sonic, density and neutron porosity logs. If the sonic logs are equipped to measure the compressional and shear waves, calculation of the mechanical properties log can quantify the sanding potential. The case studies are evidence that this methodology is functional (although it is likely conservative). Reservoir information and fluid type can be used to tune the respective thresholds to fit the known field or reservoir history.
The second case study presented a scenario where a qualitative analysis was possible despite the absence of shear wave measurements on the sonic/acoustic log. Use of proprietary pressure transient analysis software is one technique to augment initial static sanding potential assessment to account for production. This case study pointed out the need for sand control measures which should be factored into an effective completion design. In either case, the sanding potential methodology described provided a static interpretation.
Once the well is on production, it is crucial to monitor the four horsemen for signs of macroscopic shear failure. Macroscopic shear failure is due the inability of the formation and the fluids to support the overburden. This can be evaluated by tracking the changes in permeability due to formation compressibility/ compaction and by also considering skin accretion mechanisms coincident with reduced permeability. Sand production that is not caused by friability (microscopic shear failure) is a precursor sign prior to macroscopic shear failure. Macroscopic shear failure can be reduced or mitigated if the reservoir has sufficient pressure support, i.e. strong water drive.
In producing wells with sanding potential, especially for formations with high Cf such as the reservoirs in the deepwater Gulf of Mexico, sanding and shear failure can be mitigated or delayed by actively monitoring for the four-horsemen signs of macroscopic shear failure. At this stage, alternative production/ops strategies that manage drawdown should be employed. Additionally, greater attention needs to be placed on the mechanisms that exacerbate sanding potential by evaluating and monitoring pressure transient analysis properties and changes in producing fluids.
Recall that friability is on a microscopic level while formation shear failure is on a macroscopic level. An effective drawdown management plan should consider both approaches to mitigate or curtail sand production. The methodology described presents evidence to support decisions based on sand control downhole and on the surface prior to production. Reservoirs with a sanding potential should also consider the effects that production has on increasing that potential. The initial static sanding potential assessment should be augmented to account for production. This entails tracking the changes in petrophysical properties through pressure transient analysis. All the above considerations should be factored into an effective reservoir management plan. Once sand production is underway, operators must avoid nose diving into shear failure, but rather glide with monitoring and minimizing negative operational impacts to maximize recovery and return on investment.